Midterm Exam – Hacking the Humanities – Fall 2026
Introduction
For my midterm, I created an interactive map of John Muir’s writing focused on locations throughout the Yosemite Area. Muir, a prolific writer and conservationist, wrote extensively about the areas in and around Yosemite National Park. I have always enjoyed Muir’s writing, and given that it is so place-based, I figured that integrating into an interactive map is a perfect way to understand not only where his observations are based, but also the ways that they can deepen our understanding of specific locations throughout the region.
Sources
For this project, I used a topographic map of Yosemite National Park held in the University of Wisconsin, Milwaukee’s digital collections. The map, accessible here, was published in 1920. Data for this map was collected between 1893-1909, meaning it is likely an accurate depiction of the landscape Muir would have been interacting with. Additionally, I used two collections of John Muir’s writings, The Wild Muir and The Writings of John Muir to provide excerpts regarding locations of interest. For the textual component of the project, I pulled out sections and descriptions that I have read in the past that I have particularly enjoyed or found moving. Finally, I pulled images from the web for each location. Overall, the data required very little cleaning, but did require organizing my spreadsheets and associating the proper excerpts with their locations.
Processes
There were multiple stages to this project. First, in order to georeference the map, I pulled the map into AllMaps editor using the IIIF manifest provided by the University of Milwaukee. Once in the program, I used the masking tool to cut out non-geographic features of the map such as the legend and title. In the image below, everything outside of the pink box was masked out. Next, I used identifiable points on the landscape, such as mountain tops, intersections of rivers and roads (when available), to geolocate the map. This part was particularly challenging as most of the area surrounding Yosemite was not developed at the time, so it was not possible to use common georeferencing points like intersections or street corners that show up regularly on maps of urbanized areas. The georeferenced map effectively serves effectively as the reference map to digitize areas of interest. Once the georeferencing was complete, I brought the map into ArcGIS Online using the XYZ tile url provided by AllMaps.
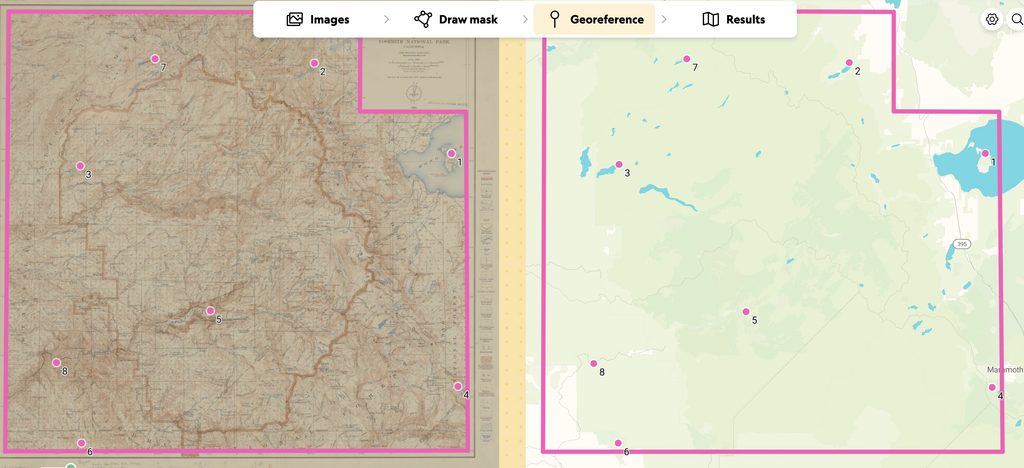
Next, I worked my way through the two texts to locate passages that I particularly enjoyed when reading the books and could also be definitively located on the map. With these locations selected, I began digitizing them in ArcGIS Online as a new feature layer using the georeferenced topographic map as my reference.
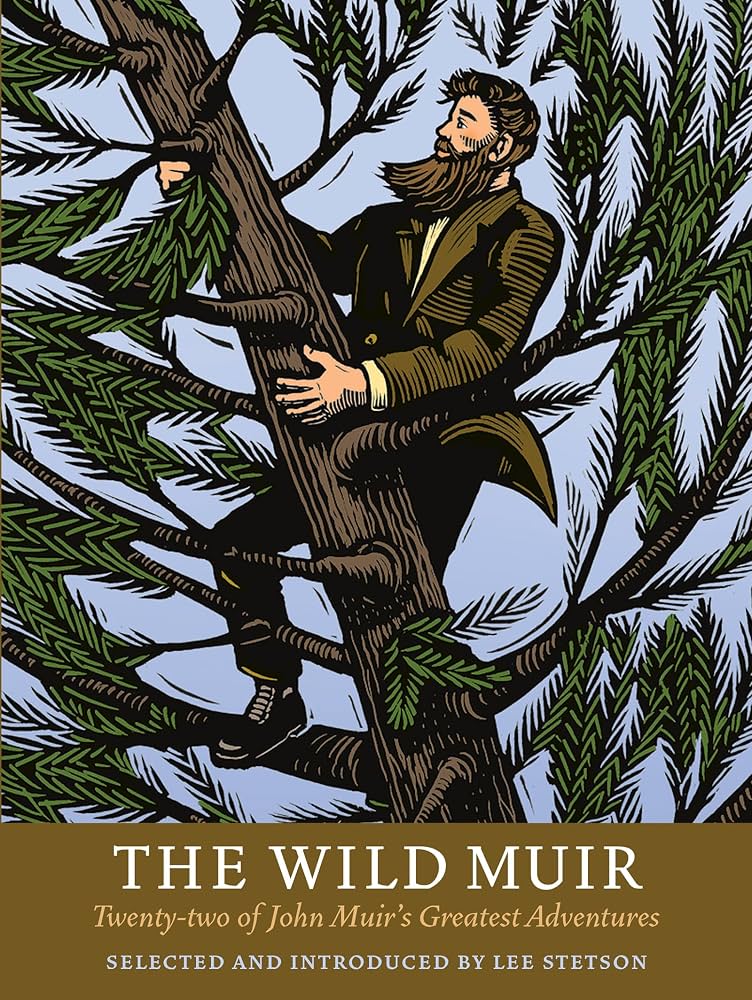
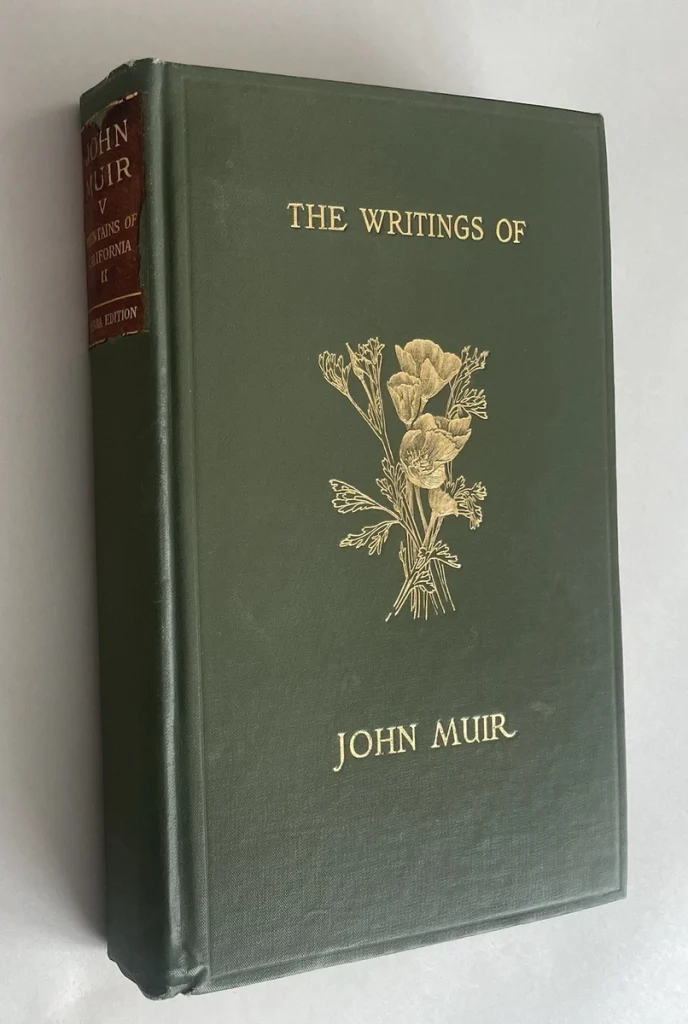
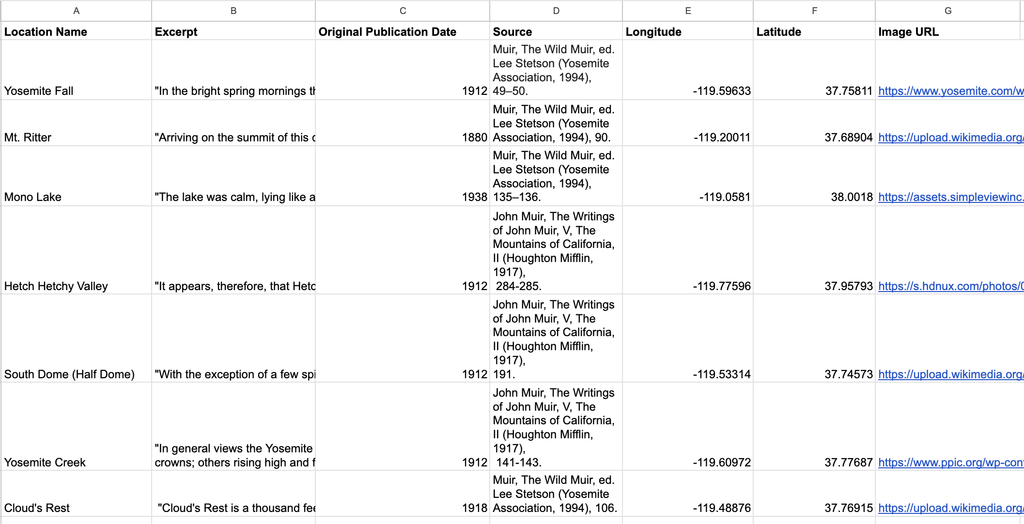
My last step was to integrate pop-ups into the map which would present the text excerpts, source and publication information, and images/image urls as spatial data. In order to do this, I created a spreadsheet, pictured below, with each of these components as a separate column. For each location, I populated Muir’s text as well as the longitude/latitude points. This allowed me to link each location to a real point on the map. Once the spreadsheet was complete, I downloaded it as a csv and created a feature layer file from it in ArcGIS Online.
Final Product #1: Basic Map
The map below is a basic display of the project. Click on the points across the georeferenced map to read Muir’s writing.
Final Product #2: Guided Tour
The map below acts an interactive tour which guides users through the project. You can use the slide navigation in the bottom right to move through the project.
Presentation
Once the map was complete, I edited the symbology to improve visualization and ease of understanding. For the “Areas of Focus” layer, I added an additional field called “Feature Type.” I then coded each feature as mountain, river/falls, lakes, and valleys. This allowed me to resymbolize the color of each polygon by its type in order for the viewer to get a sense of what different environments Muir was describing. Additionally, I attached an image of the location in each pop-up. This creates a multimedia experience (text, images, topographical data) and enhances the viewer’s sense of the landscape. Additionally, I labeled all of the locations, so that viewers could quickly know which locations were the focus of my map.
For the digital display, I created two versions of the map in Esri’s Instant App tool. I made one basic map which allows the user to pan around the map and interact with the content as they like. Additionally, I created a guided tour which brings users through each location on the map via a slide function. This provides two different experiences depending on whether they user would like guided or free-form interaction.
In terms of the website design, I wanted to highlight the map as that is the focus of the project. I added in some processual pictures, just to give a sense of what actually went into the project and what it looked like on my end as I was working. Otherwise, I kept the page fairly simple.
Significance
I think digital mapping holds great potential for revealing new insights regarding both the past and present. On the one hand, maps are something that we encounter on a daily basis, so many people are already familiar with interacting with and interpreting them. Creating interactive maps can capitalize on that familiarity while simultaneously showing new dimensions to a given space. Additionally, digital mapping can allow us to see the world in new ways. Take this project, for example. Integrating Muir’s words into the map adds a rich texture that otherwise is lost in a traditional topographic mapping. Fundamentally, his words enhance our understanding of space and what the environment may have looked like at the time. This possibility for enriching maps is endless, exciting, and most importantly can accommodate a range of voices.
A core component of Digital Arts and Humanities is creating products that not only further our understanding of the world, but do so in an accessible way. I feel that in many ways digital mapping sits at the intersection of these aims. As I said previously, we can begin to add new layers to our understanding of space and analyze how people are making sense of the world. Additionally, the digital and interactive format means that this scholarship can reach a large audience. While this format does hold many possibilities these maps are constricted by the fact that they cannot really deal with any nuance. GIS systems require discrete data. For example, we do not know exactly where Muir was standing/exactly what he was seeing in some of these descriptions, but as a creator we need make these aspects concrete. In this way, GIS systems, while powerful, do not always leave a lot of room for the messy side of the humanities.